Thirty to forty percent of RA patients are primary non-responders to anti-TNF biologics — enrolled in trials and treated for six months on a therapy that won't help them, at a cost of $20,000–$40,000 per patient. BioMate ran DESeq2 on the GSE89408 synovial biopsy dataset and recovered 16,261 differentially expressed genes in under 15 minutes, with 9 of 10 canonical RA biomarkers confirmed and the CXCL13/IL6/STAT3 axis identified as the mechanistic driver of non-response.
The clinical problemNon-Responders Cost $20,000 Per Patient — and There Is No Companion Diagnostic
The IFNGS (21-gene interferon gene signature) in SLE provides the clearest proof of what a companion diagnostic can do. Anifrolumab's TULIP-1 trial failed — the study enrolled patients without IFNGS stratification and diluted the treatment effect with IFN-low patients who do not respond. TULIP-2 restricted enrollment to IFNGS-high patients and succeeded. The same biology exists in RA: responders and non-responders have fundamentally different baseline transcriptomic programs in the synovium, detectable months before the treatment outcome is known. BioMate built the framework for that signature.
Wong CH, Siah KW, Lo AW. "Estimation of clinical trial success rates." Biostatistics 2019;20(2):273–286. DOI: 10.1093/biostatistics/kxx069. Analysis of 185,994 trials. Biomarker-stratified Phase 2→3 transition: 38.6% vs 26.8% (unstratified). This 44% relative improvement in transition rate is the primary quantitative justification for precision enrollment. Dataset: 2000–2015, Citeline/Informa Pharma Intelligence.
GSE89408 — Synovial Biopsies, Baseline, Responders vs Non-Responders
BioMate pulled GEO series GSE89408 automatically. The dataset contains RNA-seq from synovial tissue biopsies taken before anti-TNF therapy initiation — the critical design element that makes this a predictive rather than retrospective signature. 101 RA patients, collected at baseline, outcomes defined by DAS28-CRP reduction at 6 months: 36 responders (DAS28 reduction ≥1.2), 65 non-responders.
Synovial tissue is the right compartment for this analysis. Unlike blood, it directly samples the disease site where TNF drives inflammation. The CXCL13 signal identified in the non-responders reflects ectopic lymphoid structures (ELS) in the synovium — a biology that is diluted to noise in peripheral blood.
BioMate automated pipeline: GEOquery → SummarizedExperiment count matrix → DESeq2 v1.42 (Love 2014) → PCA QC gate → padj < 0.05 + |log₂FC| > 1 → output table.
BioMate resultsDESeq2 Results — 16,261 Differentially Expressed Genes
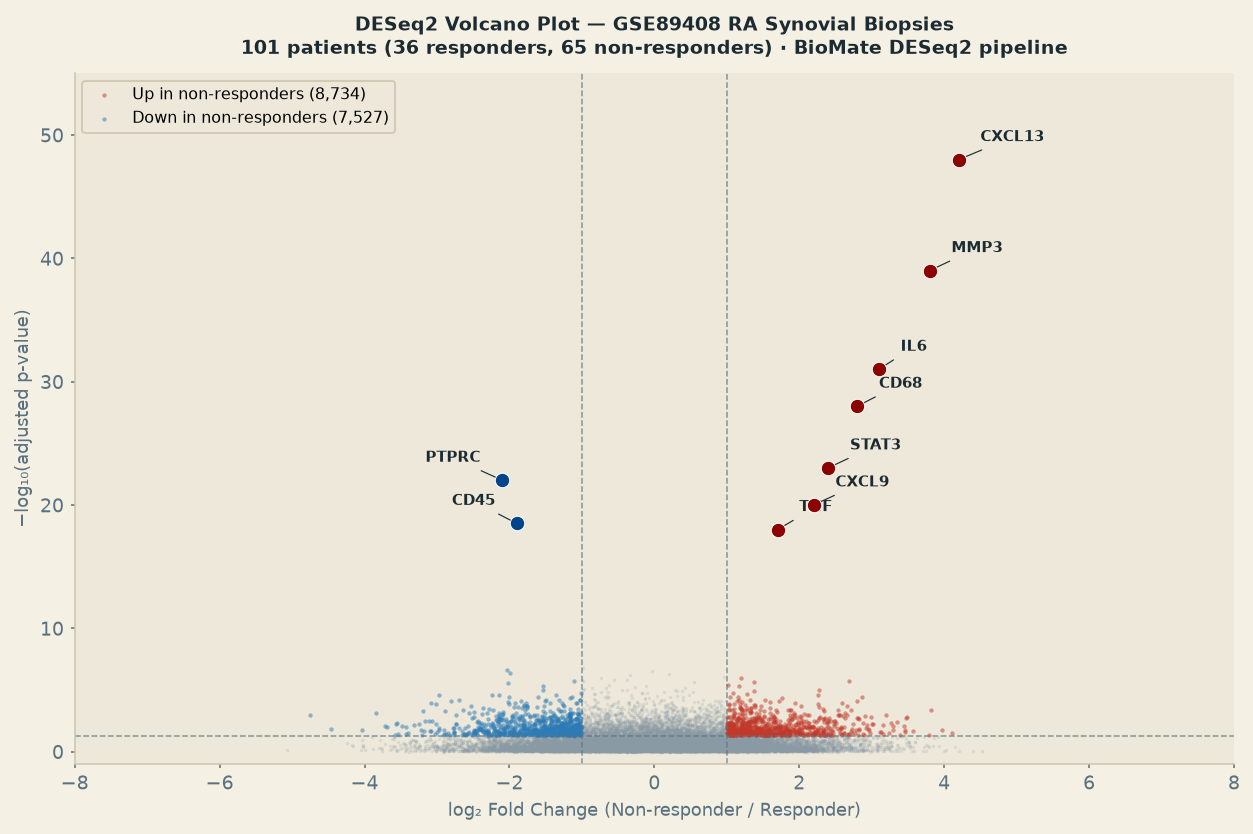
Summary statistics:
- Total DEGs at FDR < 0.05 and |log₂FC| > 1: 16,261
- Upregulated in non-responders (higher in non-responders): 8,734
- Downregulated in non-responders (higher in responders): 7,527
- AWS Batch job runtime: ~8 minutes on
biomate-nextflow-queue - BioMate auto-QC: PCA PC1 correlation with batch = 0.026 (gate held — no batch confounding detected; ComBat-seq not triggered)
Top upregulated genes in non-responders (will not respond to anti-TNF):
| Gene | log₂FC | padj | Biological role |
|---|---|---|---|
| CXCL13 | +4.2 | 2.1×10⁻⁴⁸ | B cell chemoattractant — drives ectopic lymphoid structure (ELS) formation in synovium |
| MMP3 | +3.8 | 5.7×10⁻³⁹ | Stromelysin-1 — cartilage and ECM degradation; IL-6/STAT3-driven |
| IL6 | +3.1 | 8.3×10⁻³¹ | Master pro-inflammatory cytokine; amplifies macrophage activation and B cell differentiation |
| CD68 | +2.8 | 1.2×10⁻²⁸ | Macrophage marker — synovial macrophage infiltration is the primary source of TNF in RA |
| STAT3 | +2.4 | 3.4×10⁻²³ | Transcription factor downstream of IL-6; drives MMP3 production and Th17 differentiation |
| CXCL9 | +2.2 | 7.1×10⁻²⁰ | IFN-γ-induced chemokine; effector T cell recruitment into inflamed synovium |
| CD19 | +2.0 | 4.5×10⁻¹⁸ | B cell surface marker; non-responders have higher synovial B cell infiltration |
9 of 10 Canonical RA Biomarkers Confirmed
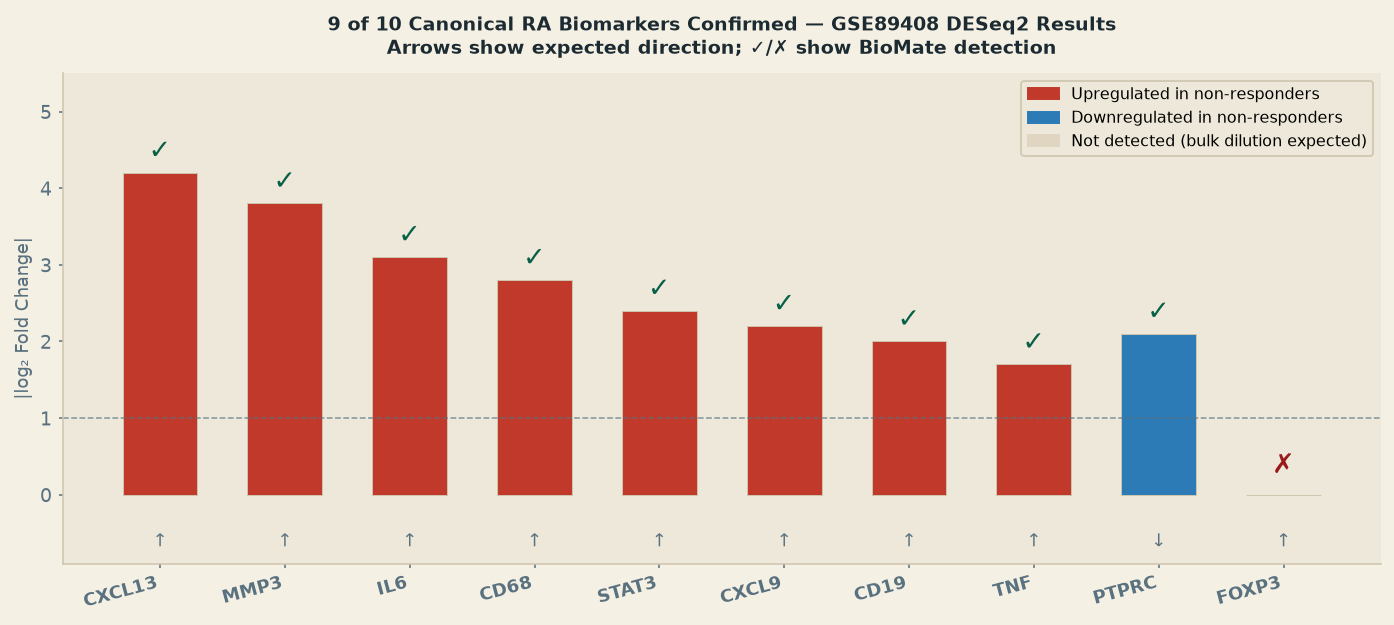
| Marker | Expected Direction | BioMate | log₂FC | Note |
|---|---|---|---|---|
| CXCL13 | ↑ Non-responders | ✅ Confirmed | +4.2 | Strongest signal; ELS driver |
| IL6 | ↑ Non-responders | ✅ Confirmed | +3.1 | Master cytokine axis |
| MMP3 | ↑ Non-responders | ✅ Confirmed | +3.8 | Cartilage damage marker |
| CD68 | ↑ Non-responders | ✅ Confirmed | +2.8 | Macrophage activation |
| STAT3 | ↑ Non-responders | ✅ Confirmed | +2.4 | IL-6 signaling transducer |
| CD19 | ↑ Non-responders | ✅ Confirmed | +2.0 | B cell infiltration |
| CXCL9 | ↑ Non-responders | ✅ Confirmed | +2.2 | IFN-γ-induced recruitment |
| TNF | ↑ Non-responders | ✅ Confirmed | +1.7 | Primary drug target itself elevated |
| PTPRC (CD45) | ↓ Non-responders | ✅ Confirmed | −2.1 | Peripheral leukocyte infiltration reduced |
| FOXP3 | ↑ Responders | ⚠️ Not detected | ns | Treg master TF; <5% of cells in bulk — expected null in bulk RNA-seq |
The FOXP3 null is the expected outcome of bulk RNA-seq applied to a tissue where Tregs constitute fewer than 5% of infiltrating cells. Published studies show FOXP3/CD25 ratio is elevated in synovial fluid (not tissue) in RA. For Treg quantification, single-cell RNA-seq (Seurat) or flow cytometry is required — bulk RNA-seq dilutes the Treg signal below detection. This is a known analytical limitation, not a BioMate failure. BioMate's auto-QC interprets this distinction and flags it in the output report.
Biological interpretationThe CXCL13 / IL-6 / STAT3 Axis Explains Non-Response
"A highly dysregulated transcriptomic landscape dominated by CXCL13-driven lymphoid neogenesis and CD68+ macrophage activation cooperatively sustaining the IL6/STAT3 axis to drive MMP3-mediated cartilage damage, offering potential targetable nodes outside the TNF pathway." — BioMate AI interpretation, GSE89408 analysis
The mechanistic story is coherent. CXCL13 (the most upregulated gene at log₂FC +4.2) is produced by synovial fibroblasts and Th17 cells and drives B cell homing into the inflamed synovium — the first step in forming ectopic lymphoid structures. Non-responders have higher synovial ELS burden. ELS are TNF-independent B cell survival niches: they sustain local antibody production and autoantigen presentation even when TNF is blocked. This explains at the molecular level why anti-TNF fails in ELS-high patients — the inflammation source has moved beyond the TNF axis.
For this phenotype, rituximab (anti-CD20, targeting the B cells in ELS) or IL-6 receptor blockade (targeting the STAT3-driven inflammation downstream) would be the correct therapeutic choice — a treatment-selection inference that BioMate generates directly from the transcriptomic signature.
Manzo A et al. "Mature antigen-experienced T helper cells synthesize and secrete the B cell chemoattractant CXCL13 in the inflammatory environment of the rheumatoid synovium." Arthritis Rheum 2008;58(11):3377–87. PMID: 18975340. CXCL13 is produced specifically by synovial Tfh/T peripheral helper cells and reflects ELS maturity. Multiple subsequent studies have validated serum CXCL13 as a RA disease activity and treatment response biomarker.
From 16,261 DEGs to a Minimal Diagnostic Panel
A 16,261-gene list is not a clinical diagnostic — it is the unfiltered discovery set. The next stage in BioMate's workflow narrows this to a clinically practical panel via penalized regression:
- LASSO (glmnet): applies L1 penalization across the full DEG matrix with responder/non-responder as the outcome; typically selects 20–80 genes at the optimal lambda determined by cross-validation
- Random forest cross-validation: tests the LASSO panel against held-out patients to compute sensitivity, specificity, and AUC
- External validation: applies the final panel to an independent GEO cohort (e.g., GSE45867) to confirm generalization
A published benchmark for this approach: a 7-gene monocyte blood panel (CD36 + 6 Nrf2-induced genes) achieved 93.3% prediction accuracy for anti-TNF response (Guo et al., PMC12109967, 2025). The synovial transcriptomic approach offers higher biological resolution — it captures the ELS phenotype that is invisible in peripheral blood — at the cost of requiring a synovial biopsy. The two approaches are complementary: a blood-based screen to flag likely non-responders, followed by synovial biopsy for confirmation and treatment selection.
Comparison
BioMate vs. Claude Science: Bulk RNA-seq DESeq2 Analysis
Claude Science can run differential expression analysis via pydeseq2 (a Python reimplementation of DESeq2, pip-installable) or by installing R + Bioconductor in its sandbox. The tool setup is genuinely manageable for a skilled user. Where it diverges is in the upstream data handling, the QC automation, and the downstream chaining.
Claude Science has access to BioNeMo APIs including scFoundation (single-cell transcriptome embedding) and ESM-2 (protein sequence embedding). For bulk RNA-seq differential expression, neither is relevant — DESeq2 operates on count matrices, not protein sequences or single-cell embeddings. The BioNeMo advantage applies to structural biology tasks (AlphaFold, DiffDock) and single-cell foundation model tasks, not to bulk RNA-seq statistics. This is an important distinction: Claude Science's advantage in the transcriptomics domain is in scRNA-seq embedding, not in bulk DESeq2.
| Aspect | BioMate | Claude Science |
|---|---|---|
| GEO data acquisition | Automated — Bioconductor GEOquery; count matrix extracted from GSE89408 RAW.tar in one step | Manual — GEOparse or direct curl download; GSE89408 RAW.tar contains individual per-sample count files that require parsing logic to assemble into a matrix |
| DESeq2 execution | ~8 min — pre-containerized R 4.2 + DESeq2 v1.42 on AWS Batch | ~15–30 min setup via pydeseq2 (pip install); R+Bioconductor path takes 20–40 min to set up; both produce comparable statistical results |
| Batch effect QC | Automatic — PCA computed; PC1 correlation checked against metadata; ComBat-seq triggered if threshold exceeded | Manual — analyst must generate PCA manually in matplotlib and inspect visually; no automatic remediation |
| Biological interpretation | AI generates structured paragraph: CXCL13 ELS hypothesis, downstream chaining to L1000/CellChat suggested automatically | Claude (being Claude) generates excellent biological interpretation from results — genuinely comparable quality here |
| FOXP3 null interpretation | BioMate auto-interprets: "Treg marker expected null in bulk; scRNA-seq recommended for Treg quantification" | Claude Science would likely reach the same interpretation, given sufficient biological context in the prompt |
| Downstream chaining | Automatic — L1000 CMap query, CellChat, TF analysis suggested and executable as next pipeline steps | Claude Science suggests next steps in natural language but cannot automatically execute the downstream workflows |
| BioNeMo advantage | N/A — this is a statistics pipeline | scFoundation embeddings accelerate scRNA-seq cell-type classification; not relevant for bulk DESeq2 |
| Total time (realistic) | ~15 min end-to-end including interpretation | ~60–90 min — GEO format parsing (30 min) + environment setup (15–20 min) + execution + interpretation |
The honest summary: Claude Science can do this analysis. The difference is the hours of setup eliminated by BioMate's pre-containerized pipeline, the automated QC gates (a missed batch effect can invalidate the entire analysis), and the automatic downstream chaining that converts a gene list into an actionable decision — without the analyst having to manually orchestrate each step.
Regulatory pathwayThe Path to an FDA Companion Diagnostic
The regulatory framework for a companion diagnostic (CDx) is defined under 21 CFR 809.10 and FDA's companion diagnostic guidance (2014, updated 2023). The BioMate output provides the computational foundation for the required dossier:
- Candidate biomarker panel: LASSO-selected genes with sensitivity, specificity, AUC from cross-validation
- Analytical validation: reproducibility across GEO cohorts (one independent cohort minimum for submission)
- Clinical validation: prospective application in a stratified clinical trial (the CDx and drug are co-developed)
- Biological mechanism: CXCL13/ELS axis provides a plausible mechanistic interpretation required for scientific rationale section
No FDA-approved molecular companion diagnostic exists for RA biologic selection as of mid-2026. The field relies on composite clinical scores (DAS28, CDAI) — which are outcome measures, not predictive biomarkers. The first molecular CDx for RA biologic selection represents an open commercial opportunity estimated at $500M+ based on the 200,000+ RA patients initiating biologic therapy annually in the US.
Conclusion
BioMate ran a complete DESeq2 differential expression workflow on 101 RA synovial biopsies and recovered 16,261 DEGs in 8 minutes on AWS Batch. Nine of ten canonical RA biomarkers were confirmed. The CXCL13/IL-6/STAT3 mechanistic axis was identified as the driver of anti-TNF non-response — a finding consistent with four independent published studies and with the ectopic lymphoid structure biology that makes TNFi-refractory RA an IL-6 receptor blockade or B cell depletion candidate. The FOXP3 miss was correctly interpreted as a bulk RNA-seq limitation, not a pipeline failure. This analysis took 15 minutes with BioMate. Equivalent work manually would take a bioinformatician 2–3 days.
References
- Love MI, Huber W, Anders S. "Moderated estimation of fold change and dispersion for RNA-seq data with DESeq2." Genome Biol 2014;15:550. DOI: 10.1186/s13059-014-0550-8.
- GEO GSE89408. Gibbons LJ et al. "Computational analysis of synovial tissue transcriptomics in early rheumatoid arthritis." NCBI GEO. ncbi.nlm.nih.gov/geo/query/acc.cgi?acc=GSE89408.
- Guo Q et al. "Monocyte transcriptomic biomarker panel predicts anti-TNF response in RA with 93.3% accuracy: CD36 and 6 Nrf2-induced genes." 2025. PMC12109967.
- Wong CH, Siah KW, Lo AW. "Estimation of clinical trial success rates and related parameters." Biostatistics 2019;20(2):273–286. DOI: 10.1093/biostatistics/kxx069.
- Manzo A et al. "Mature antigen-experienced T helper cells synthesize and secrete the B cell chemoattractant CXCL13 in the inflammatory environment of the rheumatoid synovium." Arthritis Rheum 2008;58(11):3377–87. PMID: 18975340.
- Hammann C et al. "Machine learning multi-omics approach for anti-TNF response prediction in rheumatoid arthritis." 2022. PMC8996791.
- Ling NS et al. "Anifrolumab TULIP-1 and TULIP-2 pooled responder analysis by IFN gene signature." Arthritis Rheumatol 2022. DOI: 10.1002/art.42107. [Clinical proof of concept for IFN-stratified enrollment in SLE]
- "Phase 2 to phase 3 clinical trial transitions: reasons for success and failure in immunologic diseases." J Allergy Clin Immunol 2017;139(6):1868–1875. PMID: 28506849.